Logistic Map
There’s a simple function, which eventually can result in pure chaos:
xn+1 = r * xn * (1 - xn)
“Rabbits”⌗
x: current populationr: growth rate(1-x): environmental constraint
Final population: the limes of this function.
r=1.5=> 0.33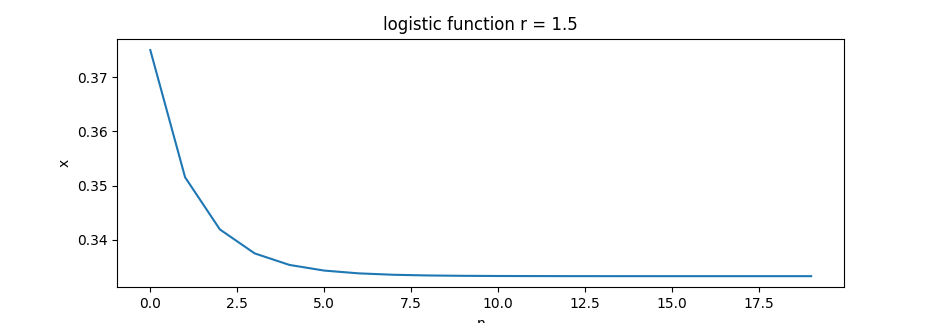
r=1.8=> 0.44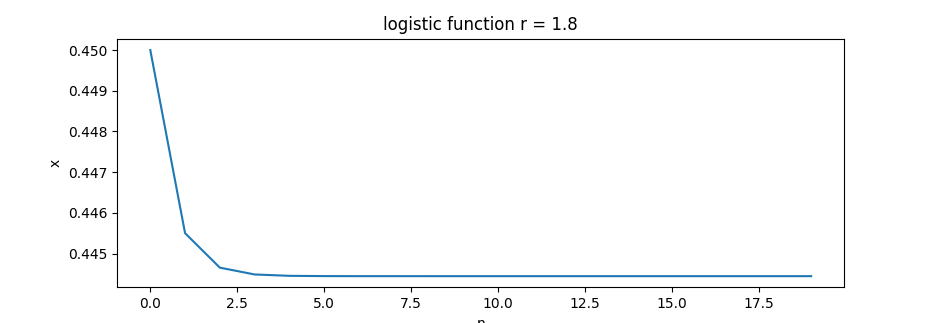
r=2.6=> 0.615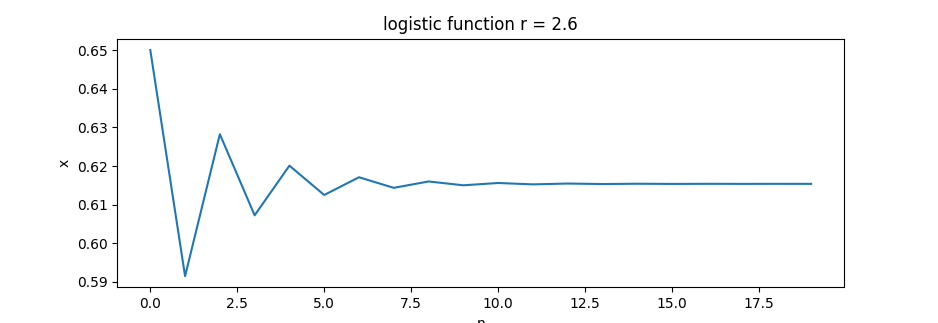
r=3.1=> ! 2 limes (oscillating) 0.558, 0.764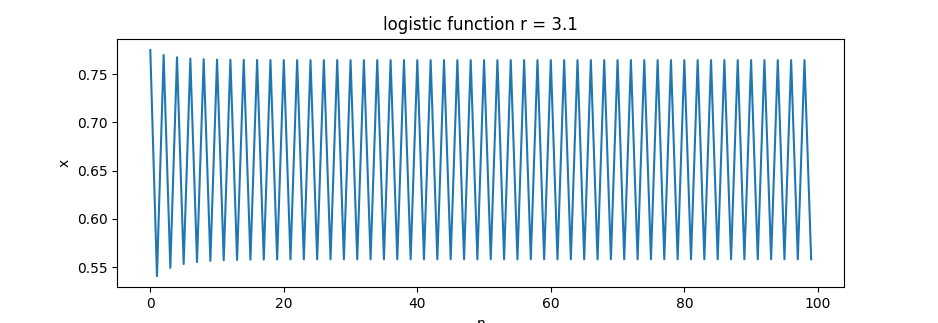
r=3.4=> 0.452, 0.842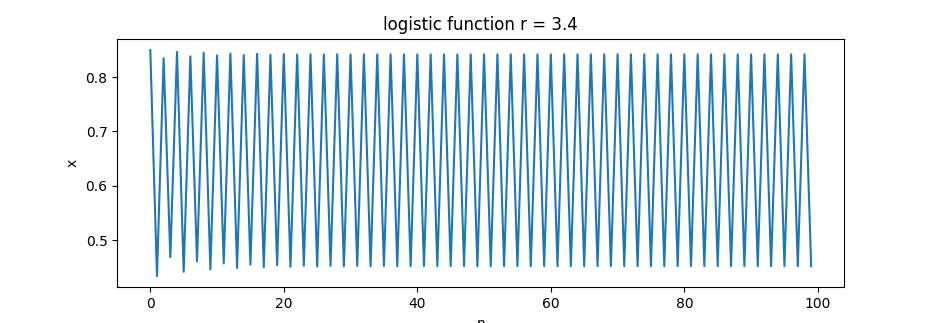
r=3.5=> ! 4 limes 0.382, 0.5, 0.826, 0.874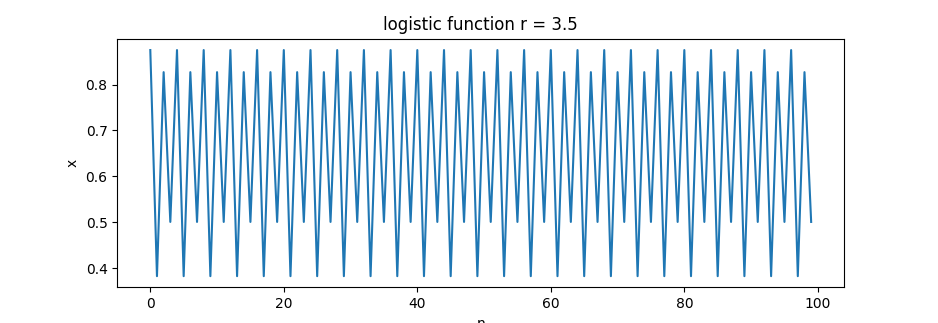
r=3.6=> ??? pRNG!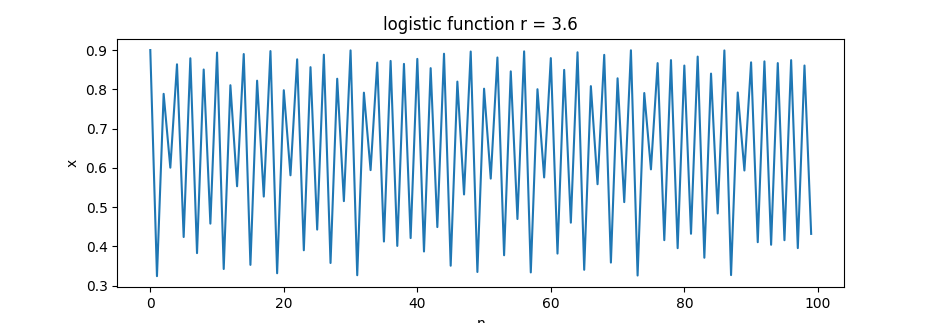
r=3.83=> 0.156, 0.504, 0.957 (?)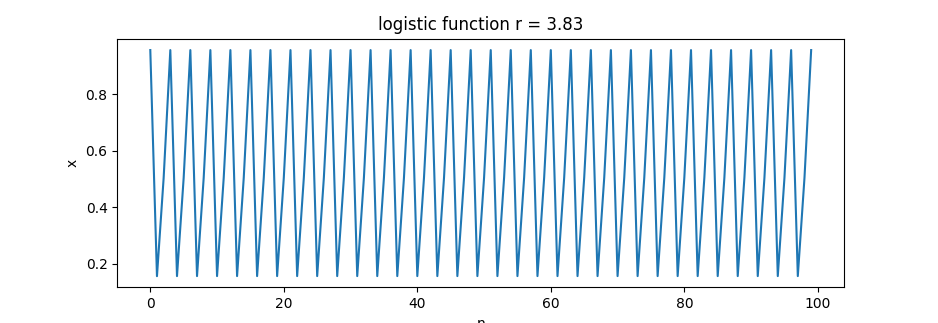
The Logistic Map⌗
If we visualize the limes(es) as a function of r, then we get the logistic map:
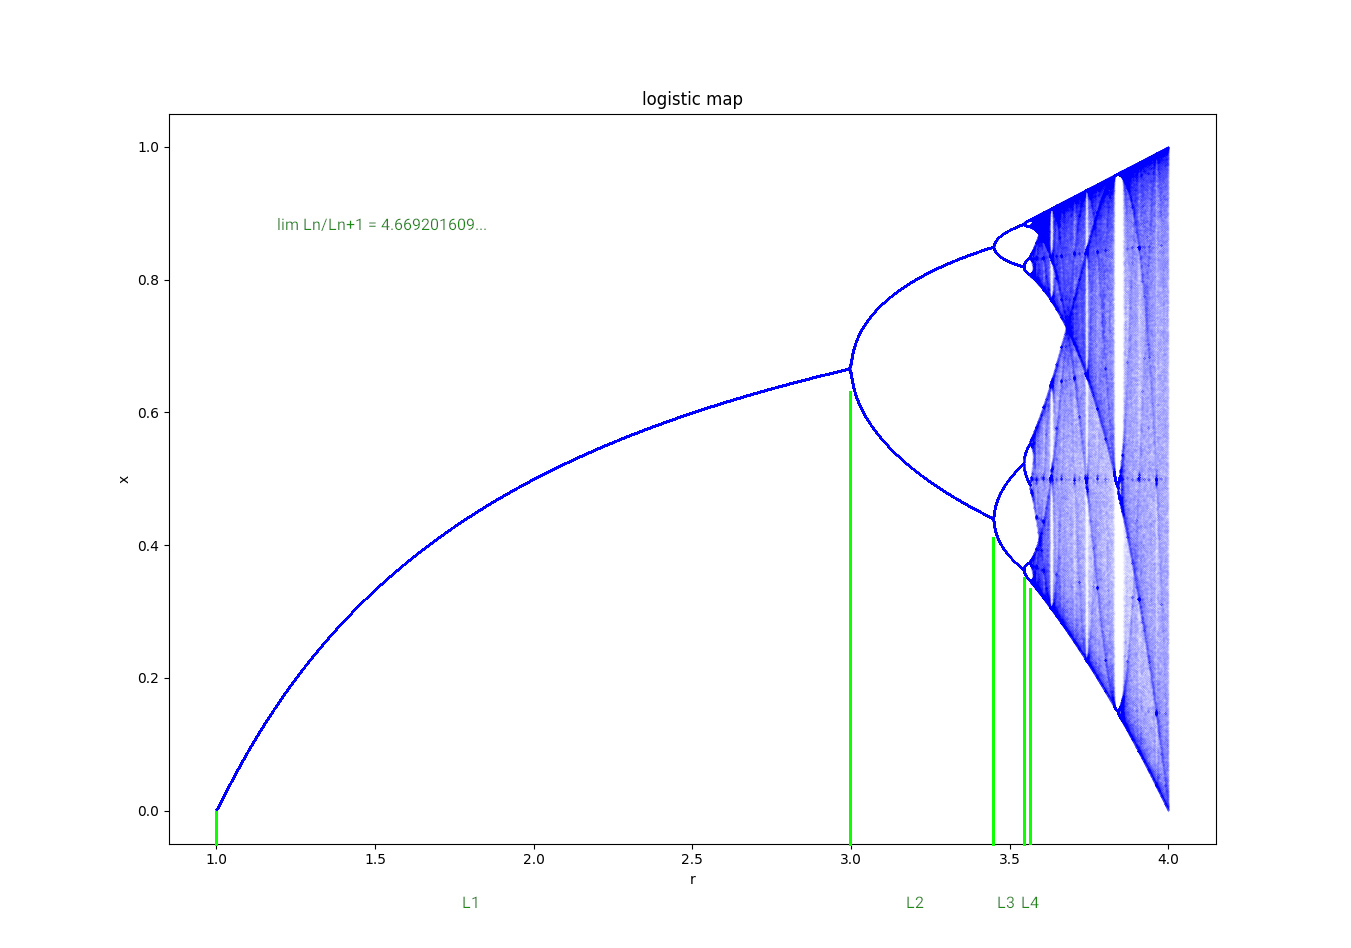
The Feigenbaum Constant⌗
The limes of the ratio of each bifurcation interval to the next between eveny period doubling:
4.669201609…
Mandelbrot⌗
The equation for the Mandelbrot set is very similar:
zn+1 = zn2 + c
It turns out that ratio of the diameters of successive circles (on the reas axis) is also the Feigenbaum constant. Also the number of “oscillations” in the Mandelbrot set is the number of the branches of the bifurcation diagram…
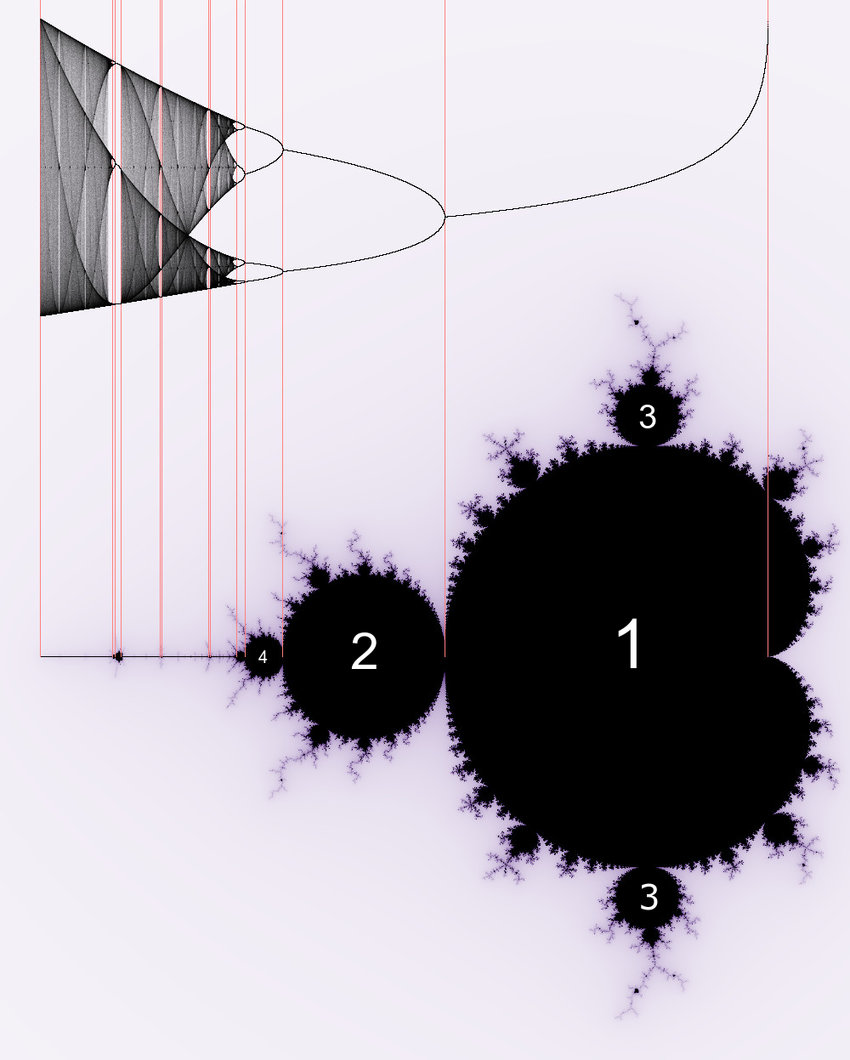 Source: reddit/r/mathpics
… and it’s happen to be found everywhere …
Source: wikipedia